Bitcoin pushes $ 110,000: Can bulls continue, or do global risks ceiling?
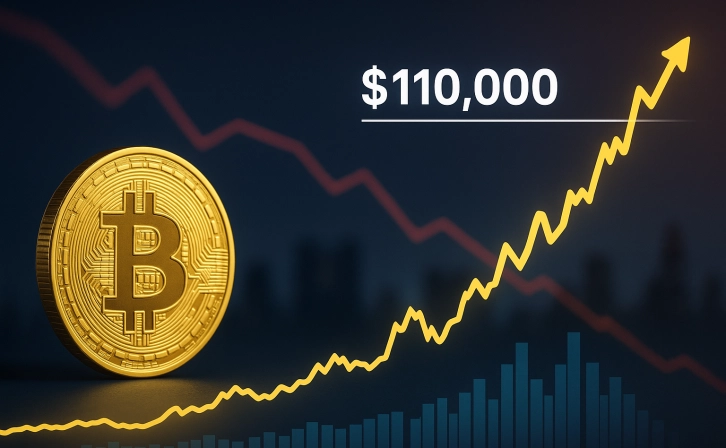
Bitcoin price climbs for $ 109,000, while technical data is strengthened. However, 82 %of the S&P 500 correlation and the uncertainty about the FED policies make it difficult for BTC above 110K.
Bitcoin (BTC) gained 3.5 %during the last weekend and reached $ 108,500. The price of $ 110,000 in psychological resistance again creates excitement among investors, while some analysts prefer to be cautious.
🧮 What does the data say?
Bitcoin’s rise between June 7 and June 9 was supported by organic market movements, not by extreme leveraged transactions. This shows that the price rises on a healthy basis. However, BTC futures premiums still indicate 5 %, ie the “neutral market” environment. Corporate investors and professional traders have not yet turned to aggressive long positions.
📈 Still 3 %: How close is the summit of all time?
On May 22, 2025, Bitcoin reached the highest level of all time (ATH) with $ 111,965. As of today, this level is only a distance of 3 %. However, it is not guaranteed yet to break this level due to the weak market momentum.
📊 Technical and Macro Risks: It is difficult to be permanent over 110k
The biggest factor that threatens the short -term rise of BTC is the high correlation with traditional markets. According to TradingView data:
The 50 -day correlation rate between Bitcoin and S&P 500 is 82 %.
This shows that Bitcoin is still perceived as an asset attached to risk appetite.
In this context, a possible recession in the United States, the fact that interest rates remain high, or the increase in geopolitical risks may restrict Bitcoin’s upward movement.
💼 US economy and debt ceiling tension
Some analysts say that the US Government is preparing for a new debt limit of approximately $ 4 trillion. This development can lead to Bitcoin’s shining as a “alternative value storage tool”.
If the investor confidence is shaken to the US treasures and the exit from the bond market begins, this capital may turn to Bitcoin. The market value of BTC is still below $ 2 trillion; This shows that even with a small capital shift, large price increases are possible.
🔄 Investor behavior: Are Bulls right or bears waiting?
📉 OKX LONG-PLACE RATE
Long-to-short ratio at the crypto derivative exchange OKX is at 4: 1 level. Although this rate still appears in favor of the Taurus, it is known that this rate has increased to excessive levels like 20: 1 in the past. So there is no extreme optimism in the market yet.
🛡 Is there any decline expectation?
No. Although it is cautious in futures, any “collapse preparation” signal from major investors or market makers is not observed. This shows that the market price, not the decline, but the price of balancing.
🔍 Summary and direction expectation:
Bitcoin is very close to $ 110,000, but has not yet completely broken.
Macroeconomic uncertainty and stock correlation limits the upward potential.
If the recession confirmation comes, the BTC may hang again for 100K.
However, the debt crisis and loss of confidence scenario may open a target gate of $ 150,000 for BTC.